Statistical & Analytical Features
Crime Data Browser
Explore data more effectively using the Crime Data Browser. Its online user interface allows you to:
- Manipulate views by dragging, dropping and nesting dimensions
- Perform cross-tabulations
- Add filters, sort, drill down, drill through, and aggregate data
- Produce highly targeted reports
- Perform in-depth analysis
- Conduct detailed research
- Choose from multiple output formats
Each website displays reports tailored for the intended audience:
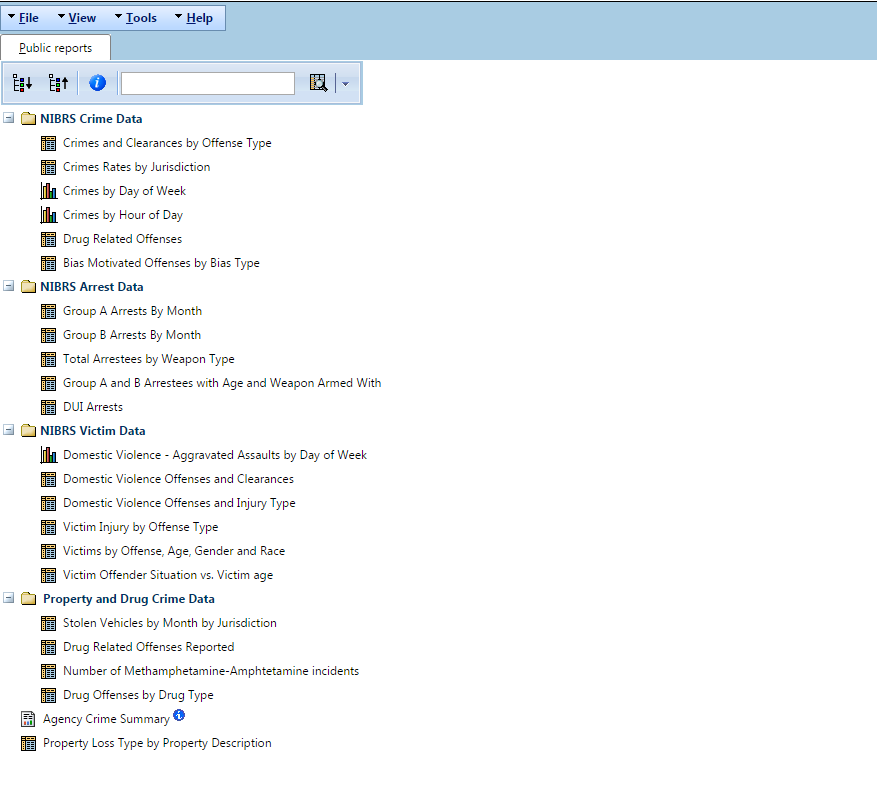
Public – for the general public – no login required. Researchers, journalists and the public will appreciate easy access to current, accurate data. Here’s the public site made available by the State of Tennessee.
Law Enforcement Agency (LEA) – for contributing agency administrators and analysts – login only. By allowing contributing agencies to view their crime data in a series of reports on the LEA site, states demonstrate the importance of reporting the data correctly and encourage consistent contribution
Administrator – for state-level repository administrators and auditors – login only
All website users can navigate the data using hierarchies, text searches and by filtering for specific dimensions.
Ad Hoc Reporting
Use Crime Insight’s powerful ad hoc reporting to produce accurate, customized reports on targeted information.
Through a web-based interface, you can manipulate views, drag, drop and nest dimensions, perform cross tabulations, add filters, sort, drill down, drill through, and aggregate data to make it easier to analyze complex data from different perspectives. Customized views can be saved for later use.


